
Shopify: Can 600x P/E Be Undervalued? (Part 1)
SaaS Incremental Rev/S&M spend has peaked, and Interest Rates might be falling. Point of Maximum Pessimism?

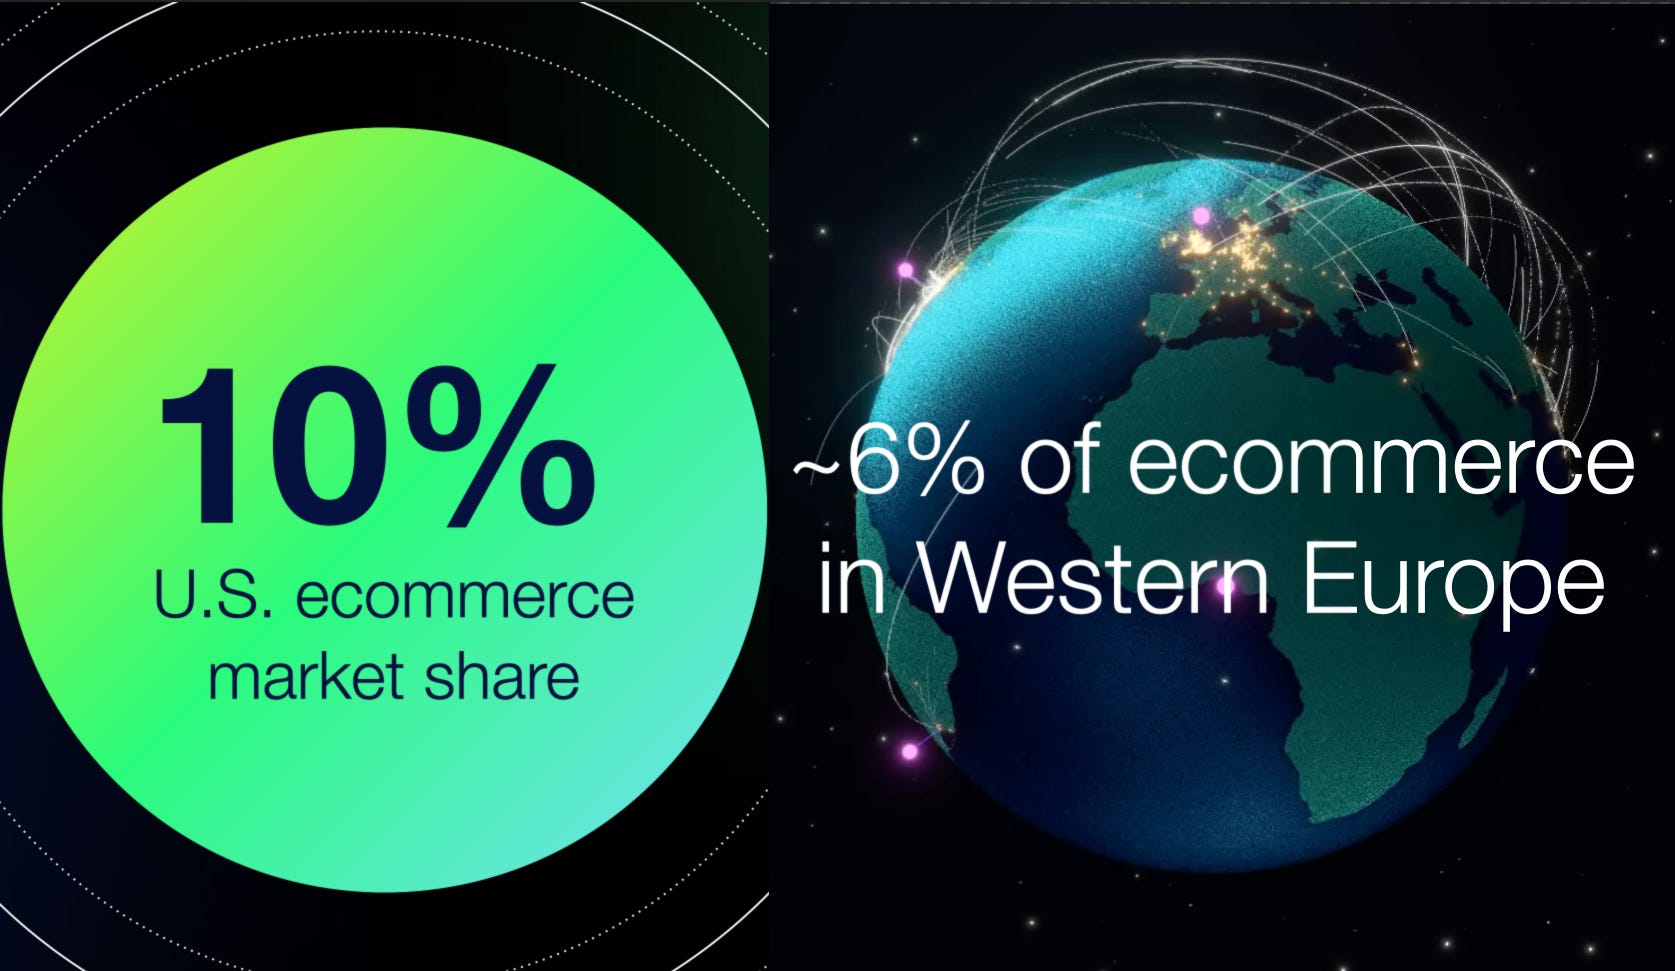
TABLE OF CONTENTS:

1. Point of Maximum Pessimism for Big Saas?

2. How Can 600x P/E Possibly Be Undervalued?

3. SHOP: 26% Revenue Growth in FY23

4. SHOP's Financial Analysis (FY16-23)

5. Valuation

6. Scenario Analysis

7. 📊 Download SHOP 3-Statement Model


Disclaimer: The contents of this document are NOT meant to serve as investment advice. Read our full disclaimers below.The sum of this implies that SHOP’s healthy revenue CAGR of 50% is completely organic and can be taken completely at face value (adjusted for scale). This has massive implications for forecasting future revenue growth, since it implies that either industry TAM is still growing like a weed; or that they are doing something super-correctly to generate such insane revenue growth independently of massive TAM growth.
Point of Maximum Pessimism for Big SaaS?

I recently came across a super-interesting presentation by Avenir titled “Avenir x Saas: What's Gone Wrong in Software and Why We're Optimistic”. You can download the full deck here — it was originally shared by one of the authors of the deck on Twitter/X.
The basic gist of Avenir’s thesis is that Big SaaS went through a classic industry-wide overcapacity until 2021 (alá O&G) — resulting in sector revenues being pulled forward, which subsequently needed to be churned through before industry conditions could normalize:
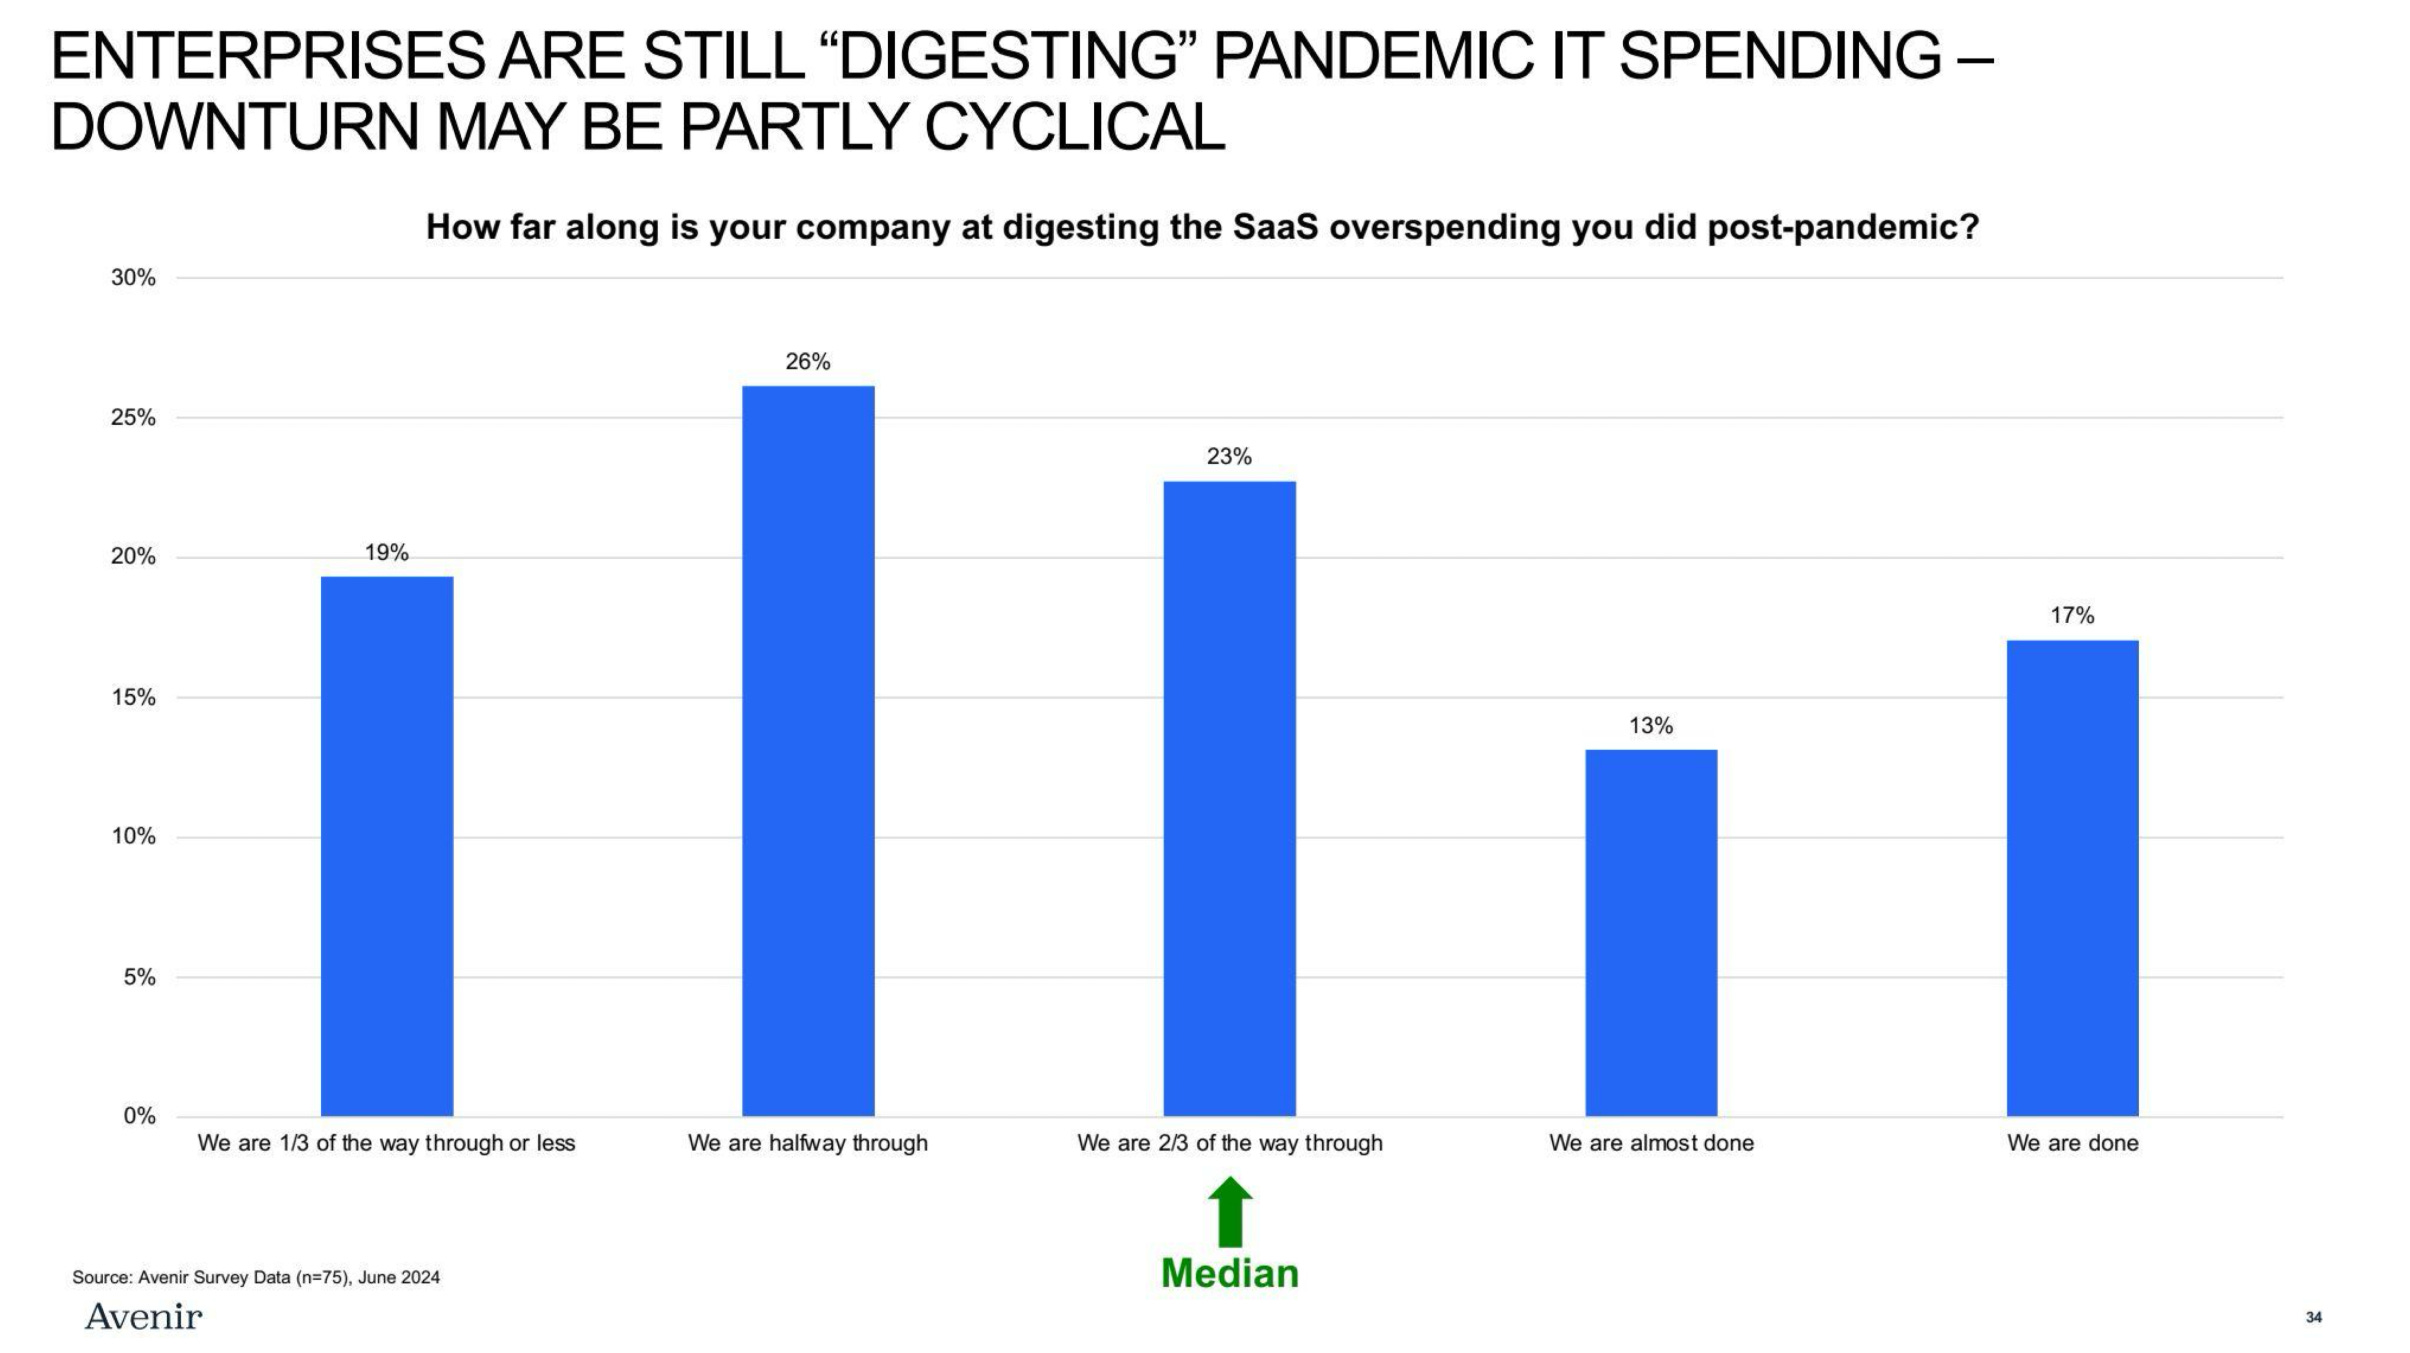
Charts like the one above demonstrate how despite the Tech sector’s (and particularly SaaS) asset-light characterization, the broader tech industry still expresses the same boom/bust cycles as other capital-intensive industries, with identical peaks/valleys as say the O&G or airline sectors. At the end of the day, competition remains the great equalizer, moats notwithstanding.
The case that Avenir made for the upcoming “SaaS-sification” of markets is twofold — i) industry valuations exhibit “point of maximum pessimism” characteristics, and ii) the overall industry is getting fitter.
I’ve grabbed some of the more straightforward charts defining this narrative from the decks and placed them below. If this has caught your attention, the full deck will be a joy for you to go through:
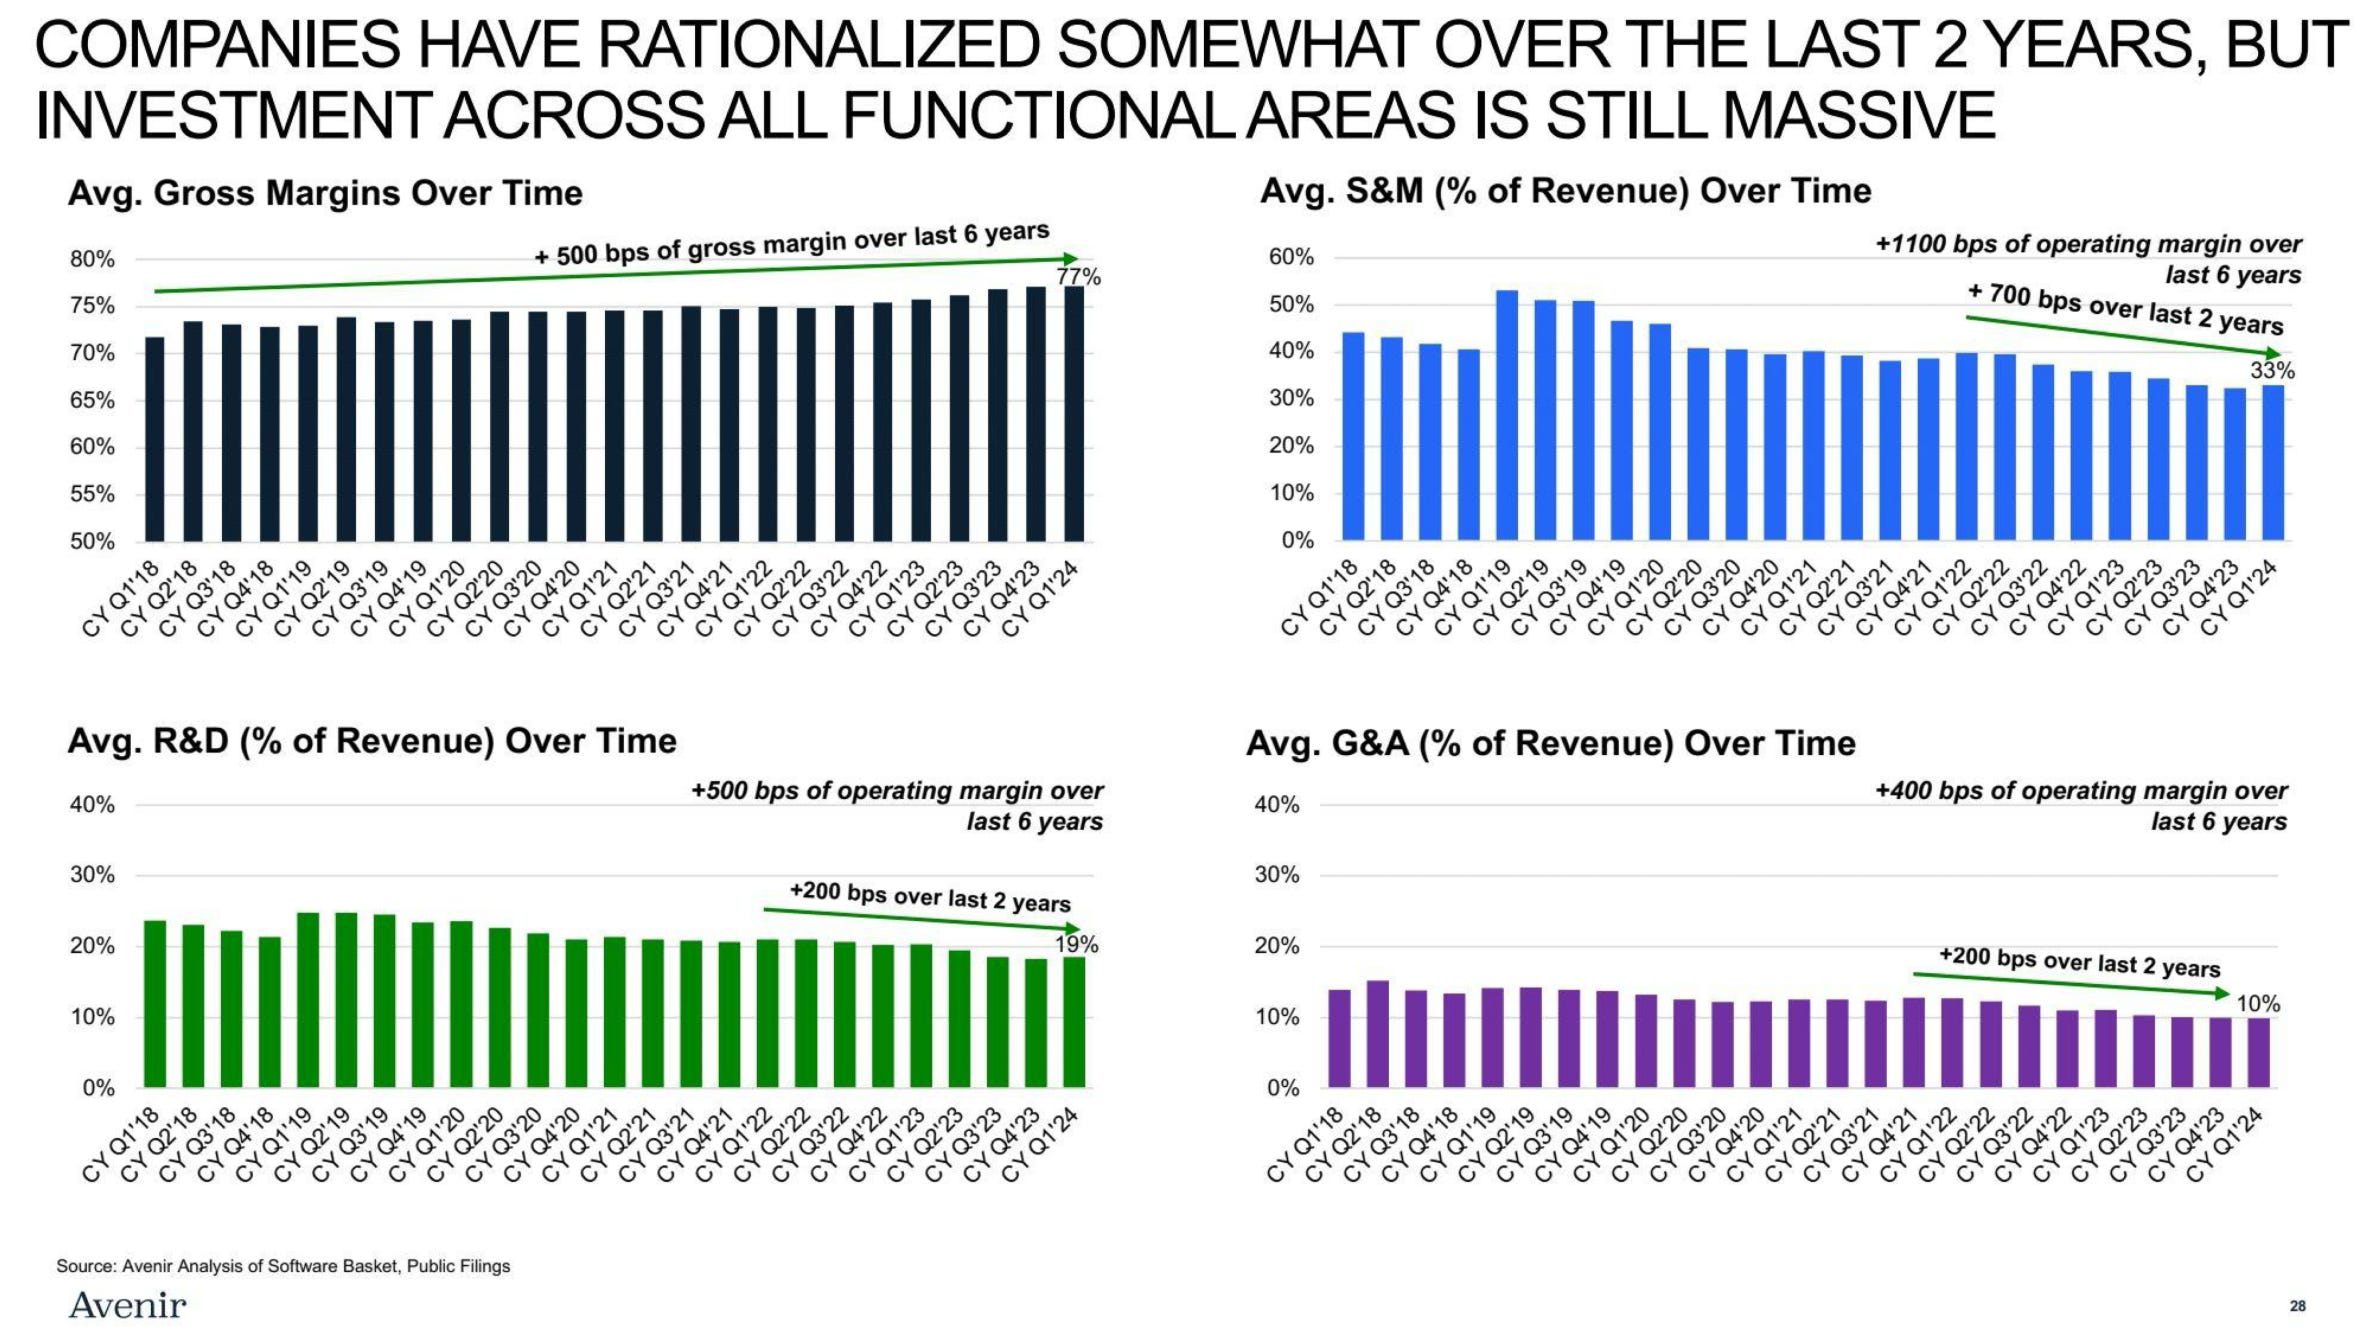
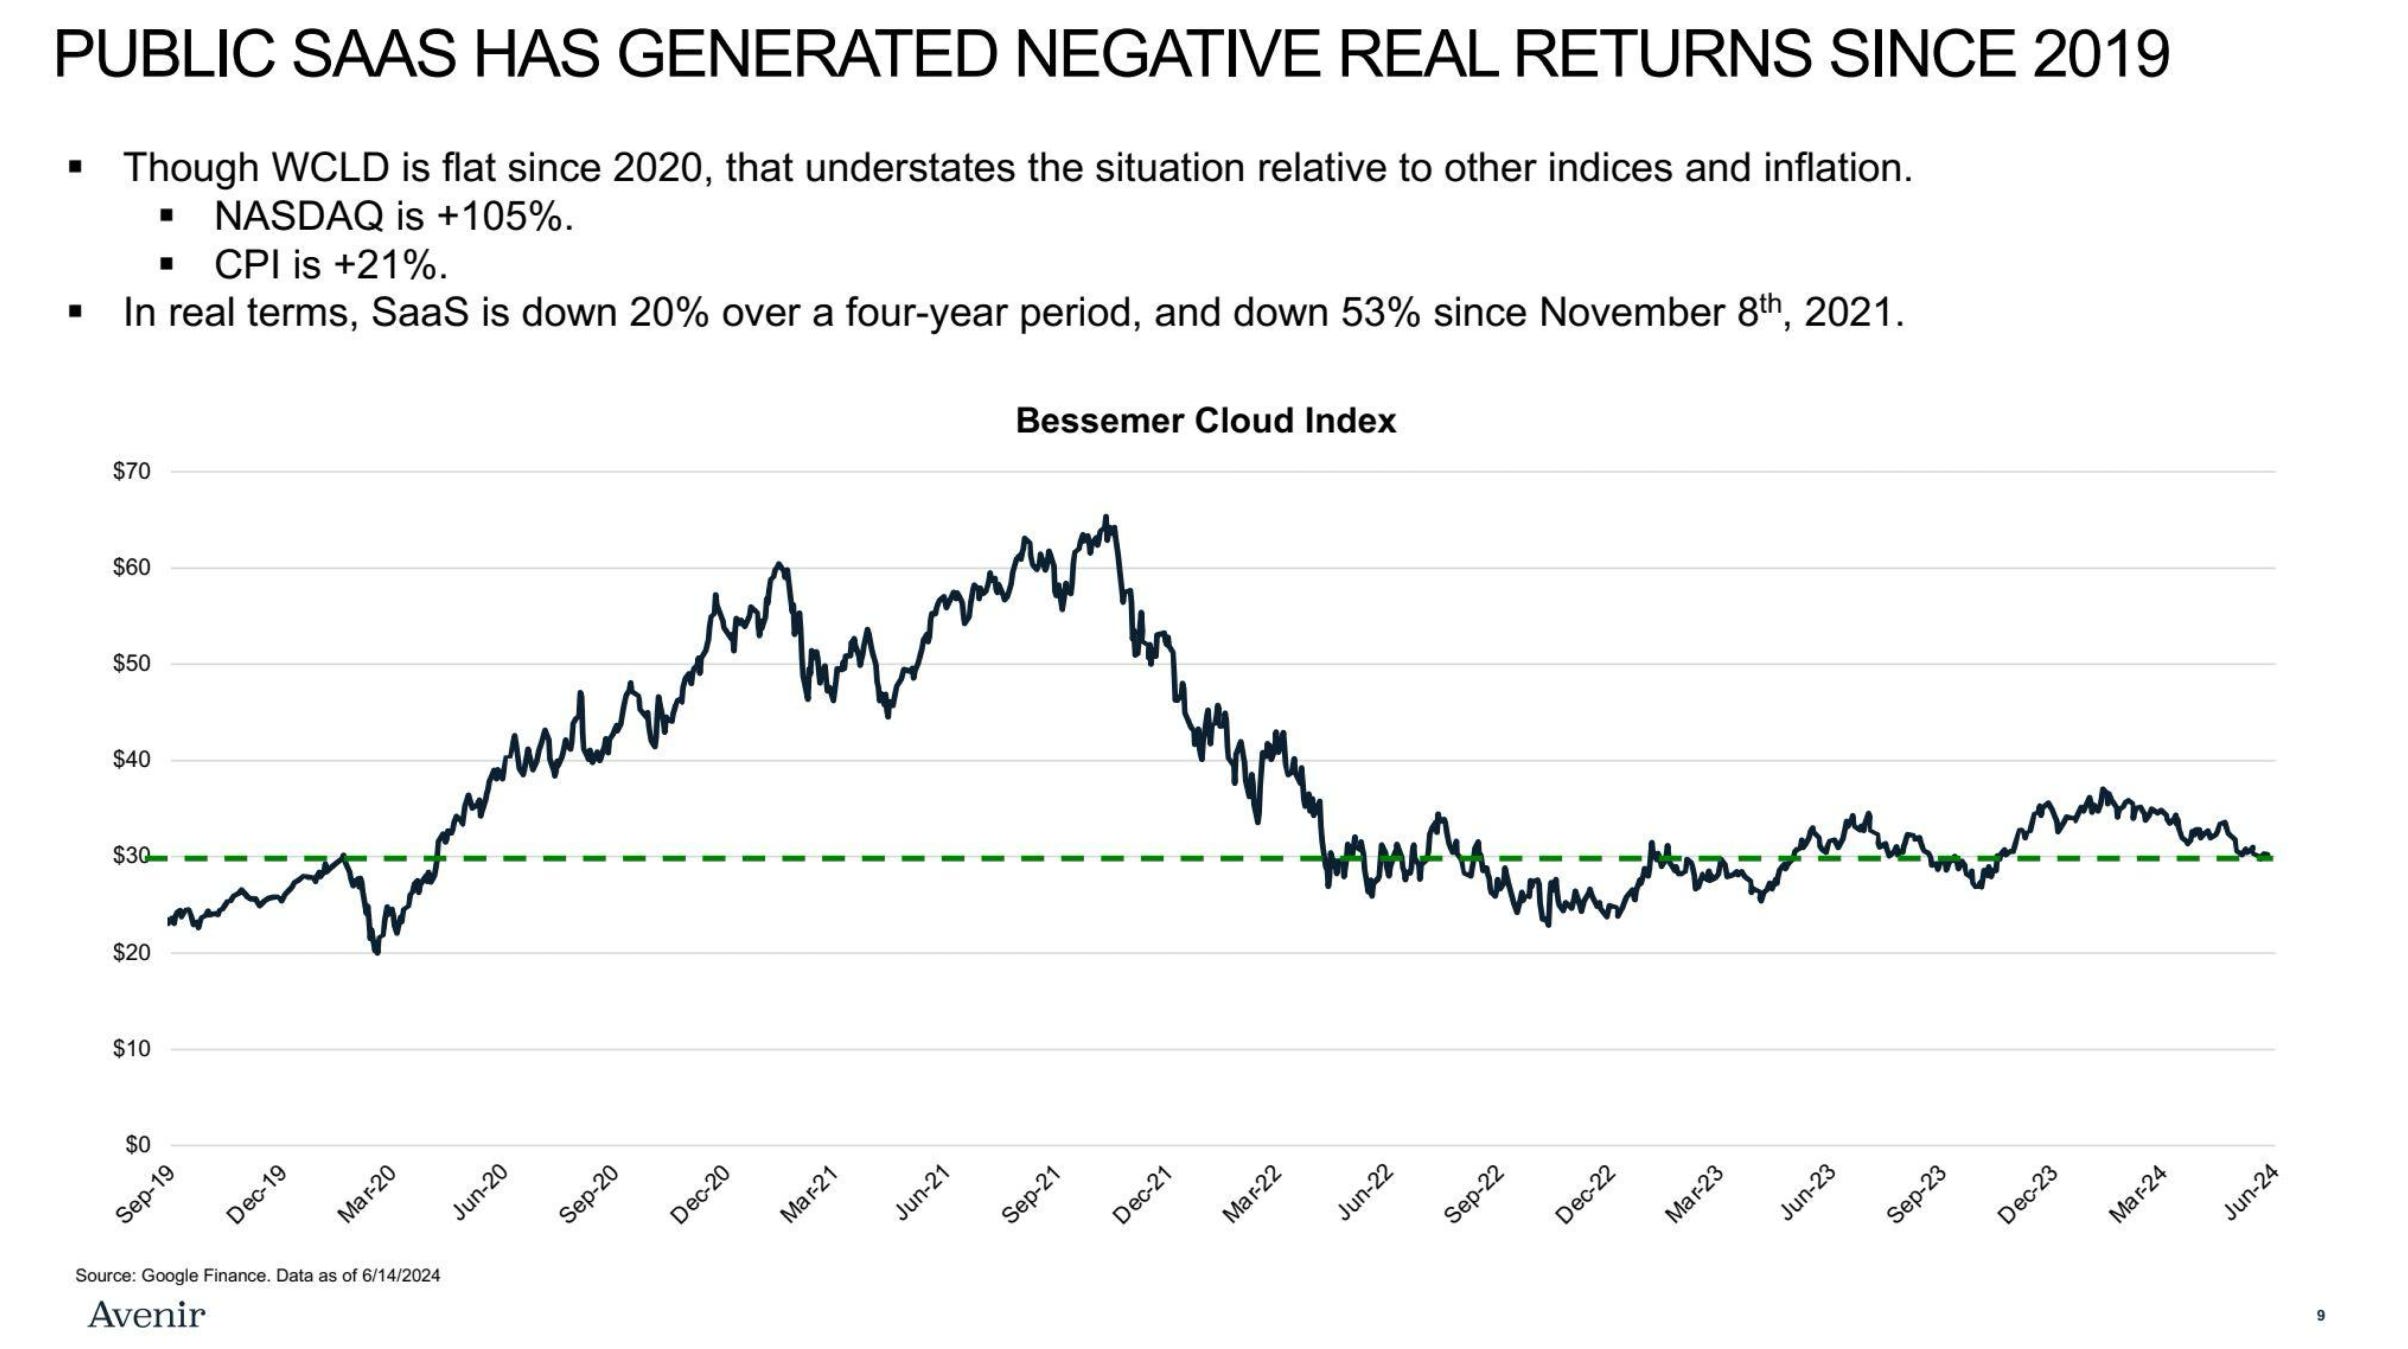
Even without typing out Avenir’s full thesis here, any seasoned industry observer should be able to fill in the blanks. It basically describes an overlap of slowing growth from pushing on a string, falling valuations, and improving margins hidden amidst sector cyclicality. Current industry multiples do not necessarily correlate with underlying performance, lending to potential industry-wide mispricings and risk:reward asymmetry resulting from excessive pessimism.
A big narrative which wasn’t mentioned in their deck though was macro. The following article demonstrates how derivative pricing is already imputing interest rate declines, undoubtedly positive for SaaS sector multiples. The (relatively) depressed multiples of non-Mag 7 Tech appears to undermine widespread economic consensus that the Fed is bound to lower interest rates sooner or later:


These findings led me down a rabbit hole of self-discovery. The objective fact is that Tech stocks have inflated multiples for a reason — they tend to be good businesses, independent of current market valuations. With the real economy entering into “Goldilocks” territory, the path of least resistance appears to imply some sort of sector rotation favoring these dead horses being reverse-beaten in some form.
How Can 600x P/E Possibly Be Undervalued?
Ultimately, this exercise of self-discovery led me to Shopify, for reasons which I shall explain in the rest of this report.
Most of us can broadly agree that Shopify is more or less in control of their own destiny — by virtue of being part of a global oligopoly within its sector. There is virtually no blow-up risk, and any serious competition to their stratospheric industry lead is found wanting.
Of course, this is also reflected in Shopify’s sky-high valuation of 11.6x P/S, 10x P/B, and roughly 600x trailing P/E — certainly not in the realms of what most people consider as “value investing”. However, we also know that “growth and value are joined at the hip”, etc etc by now.
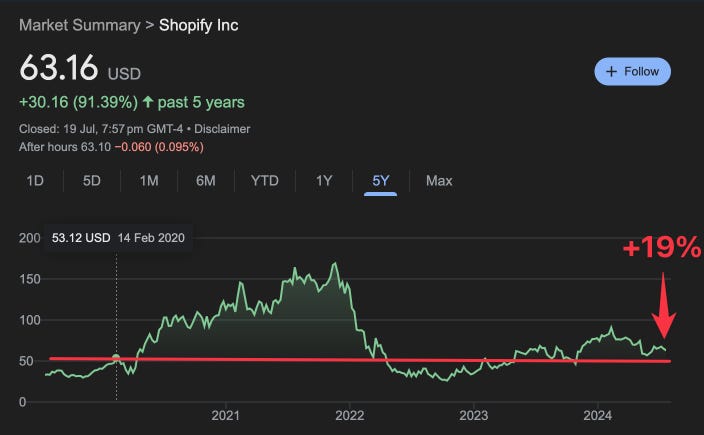
For context, their current valuation is “merely” 19% above their pre-pandemic high 4 whole years later; and only 2.5x above their lowest trough in Oct ‘22. In that same time, Shopify’s revenues have quadrupled:
For those unfamiliar with the company, here’s a quick Shopify primer. SHOP is the premier e-commerce platform for small businesses in North America. There are just a handful of global players at such scale, and to this day it’s difficult to see who can even potentially dethrone them. Even Amazon seems to be having difficulty, as evidenced by the recent making-up between the two giants on checkout options.
While Amazon’s Marketplace remains the undisputed leader for all things e-commerce, they don’t allow small businesses to brand themselves, or collect crucial customer data to inform subsequent growth strategy. It’s like the difference between a small business selling through their own store vs. through Walmart — you’d probably sell higher volumes through Walmart, but they decide how your product is presented to customers (i.e. branding) and gatekeep crucial customer data to maintain control over their suppliers.
Shopify does almost the reverse, by allowing small businesses to control their own e-shopfront’s branding and customer data collection, while taking care of all the back-end infrastructure. Their core product is shopfront subscriptions, which on the surface looks pretty similar to other website builders like Wix or Squarespace. However, the actual magic of Shopify happens behind the scenes, with over a decade’s worth of business integrations that enable small e-commerce businesses to set up shop overnight.
However, shopfront subscriptions aren’t even where Shopify generates most of their revenues. Shopify also has an in-house payments service called Shop Pay, which is effectively similar to Visa or Apple Pay. While the latter two do appear as options during checkout, customers enjoy various benefits from using Shop Pay over them when shopping at a Shopify-powered merchant (e.g. autofill customer details) and are greatly incentivized to use them. Merchant Solutions generated nearly 75% of total FY23 revenues, with Shop Pay’s 2.9%++ take rate representing the bulk of that.
Since Shop Pay’s revenues are a function of total merchant GMV, it also significantly aligns the incentives of Shopify with its merchants — in contrast to if Shopify were merely selling them shopfront subscriptions. This symbiotic relationship — where what’s good for merchants is also good for Shopify — elevates the entire merchant ecosystem, which stands in sharp contrast to competitor e-commerce marketplaces like Amazon who are incentivized to engage in “your margin is my opportunity” games with their own merchants.
That’s all you really need to know about Shopify’s competitive advantage. They are so far ahead of everyone else in the space that few industry observers would worry about it at all. The main sticking point with SHOP has been precisely that — since everyone knows about their moat, their shares currently trade at a whopping 11.6x P/S ratio. On the surface, many would consider even their 20% revenue CAGR merely fair value at that price — yet a closer look reveals that maybe things are more (or less?) than they seem.
Since SHOP’s business is something very few will be unfamiliar with, I’ve chosen to begin with what most readers will presumably be more interested in — analyzing their valuation. In this SHOP Part 1 report, we’ll perform a full-fledged scenario analysis behind their valuation and explore all key levers involved. Those who are already familiar with SHOP’s business should get the most mileage out of it.
In the follow-up Shopify Part 2 report, we’ll flesh out the nitty-gritty details behind the valuation model in this week’s Part 1 — by performing a deep-dive into their business operations, recent developments, and forward-looking growth strategy. This should allow readers to fit the business and operational context back to the figures used in the valuation model in this report and test them for appropriateness.
Check out my previous articles about Value Investing:
Unpopular Opinion: Diversified Portfolio > Concentrated Portfolio
Value Investors = Business Owners. Here's The Irrefutable Proof.
How I Became 100% Convinced that Value Investing Was Superior

SHOP: 26% Revenue Growth in FY23
As the title alludes to, it’s quite hard to reconcile Shopify’s current market cap with the colloquial notion of value investing. So how do we square this circle given SHOP’s 11.6x P/S? It all begins with their sky-high revenue growth, which was 26% in FY23.
Given Shopify’s uncomplicated Tech business model, only a few items in their P&L statements move the needle for their bottom-line. This makes it relatively simple to perform a scenario analysis for these KPIs — and try to square their future earnings with their market cap.
Before we get into the meat of the analysis, let’s get the ancillary stuff out of the way first — their balance sheet & cash flows.
As you might expect from a business with global oligopolistic status, SHOP’s going concern risk is virtually nil. They are in a healthy Net Cash position of $4B, and their Cash Conversion Ratio (OCF/NP) is regularly in the black:
Keep reading with a 7-day free trial
Subscribe to Value Investing for Professionals to keep reading this post and get 7 days of free access to the full post archives.